Rule Analyzer
- May 10, 2023
- 3 min read
Updated: May 17, 2023
In this article: 1. Feature Description
2. Setup
3. Sections Overview
4. Rule Analysis
5. Rule Usage Trending
Feature Description: Rule Analyzer is a tool to visually depict the anatomy of dFW Sections, Rules, Top N information and rule statistics. This information is useful to help understand the usage of a given policy and provide a basis for cleaning up firewall rules. The data is retrieved from NSX Manager but can also be historically stored on-box for trending analysis.
Minimum Release: 2.8
Application: NSX-v, NSX T, VMCoAWS
License: Enterprise
Privilege level: Audit or higher
Setup To top
No setup required for basic analysis. For historical trend reporting, a user can define an interval of time (in minutes) to collect dFW stats on a per rule or section basis. During this interval, statistics will be gathered and stored in ReSTNSX.
Sections Overview To top
To view analyzed dFW data, navigate to Reporting > Rule Analyzer or by clicking the pie chart in Operations > dFW on any given section header.

Upon loading, a summary of all the dFW sections is presenting. This summary illustrates the anatomy of all dFW sections. Additionally, users can click on a given section in the donut chart to reveal its specific anatomy (source, destination types).

ℹ️ To improve performance, the Section Analysis graphs are using cached data based upon the last user login to Operations > dFW page. If you wish to refresh (re-discover) this data real-time, click the refresh icon above the “Select a Section” drop-down.
Rule Analysis To top
To review the analysis of all dFW Sections or a specific Section, select from the list above the Policy Overview Graph. This will launch an analysis using either real-time or cached data. Starting in version 3.6, duplicate object analysis is included. This feature will review rules for exact duplication or effective duplication by calculating effective members (IPs) for comparison.
ℹ️ To improve performance, an option for using cached data is provided when “All Sections” are selected for analysis. The cached data is based upon the last System Report that was collected. For rule sets above 2,000 in size, real-time analysis may take 5 or more minutes to complete.
Once a section is selected, each rule within the section is displayed in a table showing the hit count statistics with the ability to easily filter rules that have not been hit in the last 30, 90, 180 days or never hit. Click on the donut chart to filter based upon these timeframes.

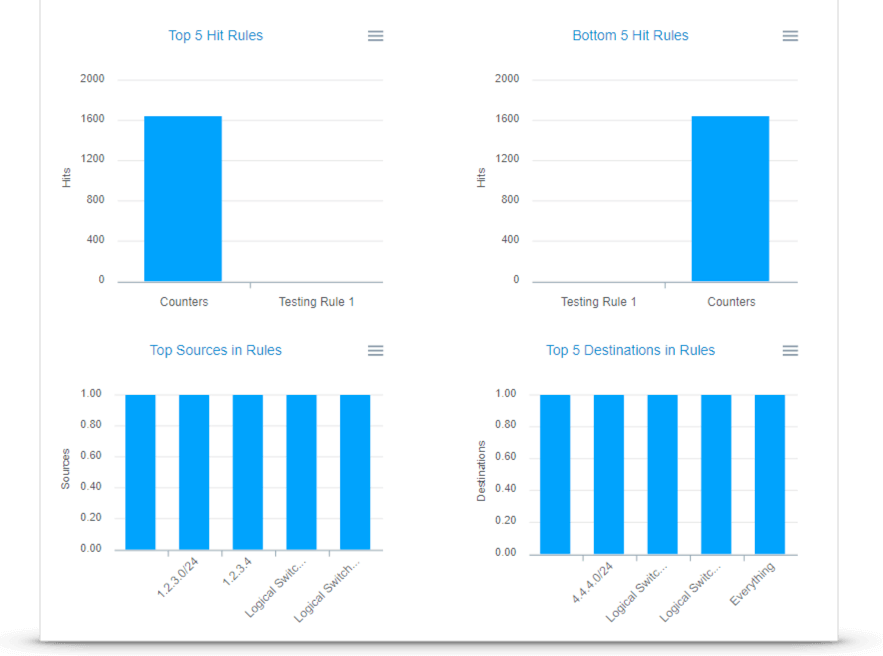
For each section, or if all sections are selected, the top N metrics are displayed across all rules
Rule Usage Trending To top
The above data is using the most recent NSX data available for the rule statistics. ReSTNSX also provides the user the ability to add in a custom, per rule, capture interval for collecting hit counts. In this mode, ReSTNSX will collect and store the hit counts for trending analysis.
ℹ️ This capability was introduced in ReSTNSX 3.5
To enable or disable collection statistics, navigate to Operations > dFW > Section Header menu and select Rule Statistics Collection History as shown below. Select one or more rules, the interval (in minutes) for collecting the statistics and select OK.

Once this is saved, ReSTNSX, in the above example, will collect dFW statistics for the rule named “Counters” every 1 minute. When this feature is enabled, the Rule Analyzer icon in the section header will blink to indicate a collection is enabled.

To view the data, navigate to Rule Analyzer by clicking on the pie chart icon in the header. When this feature is enabled, a graph, per rule will be displayed. For each rule where collection is enabled, a green checkmark in the leftmost column titled (“Rule Stats Status”) will be displayed. Click on the rule to view the hit count trend since the feature was enabled.

💡When rule collection is disabled, the historical data is retained. The green checkmark will no longer be visible but the graph data will be displayed when the rule is selected.


Comments